Welcome to the HTML/JavaScript lesson page of the obniz Starter Kit!
In the last lesson, we learned that we can get a specific distance in succession with a distance sensor. (By the way, I think we can now use LED signals as well).
In this lesson, we will use the "temperature sensor" from the parts, and display the value of the temperature sensor on a graph in real time.
About the JavaScript plugin
JavaScript has a variety of plugins (libraries in the program) that can draw animations, draw graphs, and make writing programs much easier.
In this article, we'll use a JS plugin called Chart.js to generate a graph of the temperature values obtained from the temperature sensor!
Chart.js

Write the program
From the link given above, you go to [Install] -> [Use Chart.js CDN] (https://cdnjs.com/libraries/Chart.js) you will find various links.
Depending on the situation, you can use it as a JavaScript library by writing ".min.js" or ".js" in the header of your HTML.
So let's copy and paste it into the obniz program... But it says "obniz.js" in the same place..
Well, actually, obniz is just another JavaScript library used in this HTML file!
So, you can jump to the link given there to see the list of libraries running obniz.
Of course, since you are a user of obniz, you don't need to read this section as you do with other libraries.
Let's use it conveniently..
Now that Chart.js has been added to the HTML, let's take a look at how to use it.
The various ways to use Chart are described in Chart.js, so please look at it or search for it to understand how Chart is set up in the sample program.
The sample program has a simple structure, so of course you can add as many features as you want!
After that, we will use obniz's temperature sensor library, so let's see how to use it in Temperature Library.
No need to explain the parts in detail anymore, as the onchange function will send the temperature as needed.
Now we just need to combine the Chart.js library with the temperature sensor library!
<html>
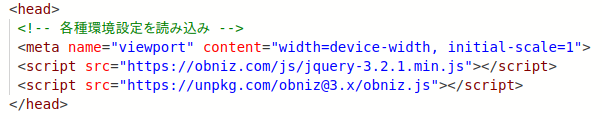
<head>
<!-- import Chart.js -->
<script src="https://cdnjs.cloudflare.com/ajax/libs/Chart.js/2.9.4/Chart.min.js"></script>
<!-- import obniz.js -->
<script src="https://unpkg.com/[email protected]/obniz.js"></script>
<canvas id="myChart"></canvas>
</head>
<body>
<script>
var ctx = document.getElementById("myChart");
var tempLists = []; //For holding temperature
var labelLists = []; //For holding the label (horizontal axis)
var obniz = new Obniz("OBNIZ_ID_HERE"); //OBNIZ ID here
obniz.onconnect = async function () { // when obniz connected...
var chart = new Chart(ctx, { // Chartの設定
type: 'line', //Make a line chart
data: {
labels: [],
datasets: [
{
label: 'Current temperature', //set label
data: []
}
]
},
options: { //Set Chart options.
scales: {
yAxes: [{
ticks: {
suggestedMax: 30, // Minimum value of y-axis
suggestedMin: 20, // Highest value of y-axis
stepSize: 1, // Indicated on the axis by 1°C
callback: function (value, index, values) {
return value + '℃' // Add "°C" after the number.
}
}
}]
},
}
});
// use Keyestudio_TemperatureSensor library
var tempsens = obniz.wired("Keyestudio_TemperatureSensor", { signal: 0, vcc: 1, gnd: 2 });
var count = 0; // count temperature change
tempsens.onchange = function (temp) { // If the temperature changes
count++;
tempLists.push(temp.toFixed(1)); //Store temperature with one decimal place.
labelLists.push(count); //Store the label
chart.data.labels = labelLists; //Reflect the label data.
chart.data.datasets[0].data = tempLists; //Reflect temperature data.
chart.update(); //Redraw the graph
console.log(temp.toFixed(1));
};
}
</script>
</body>
</html>
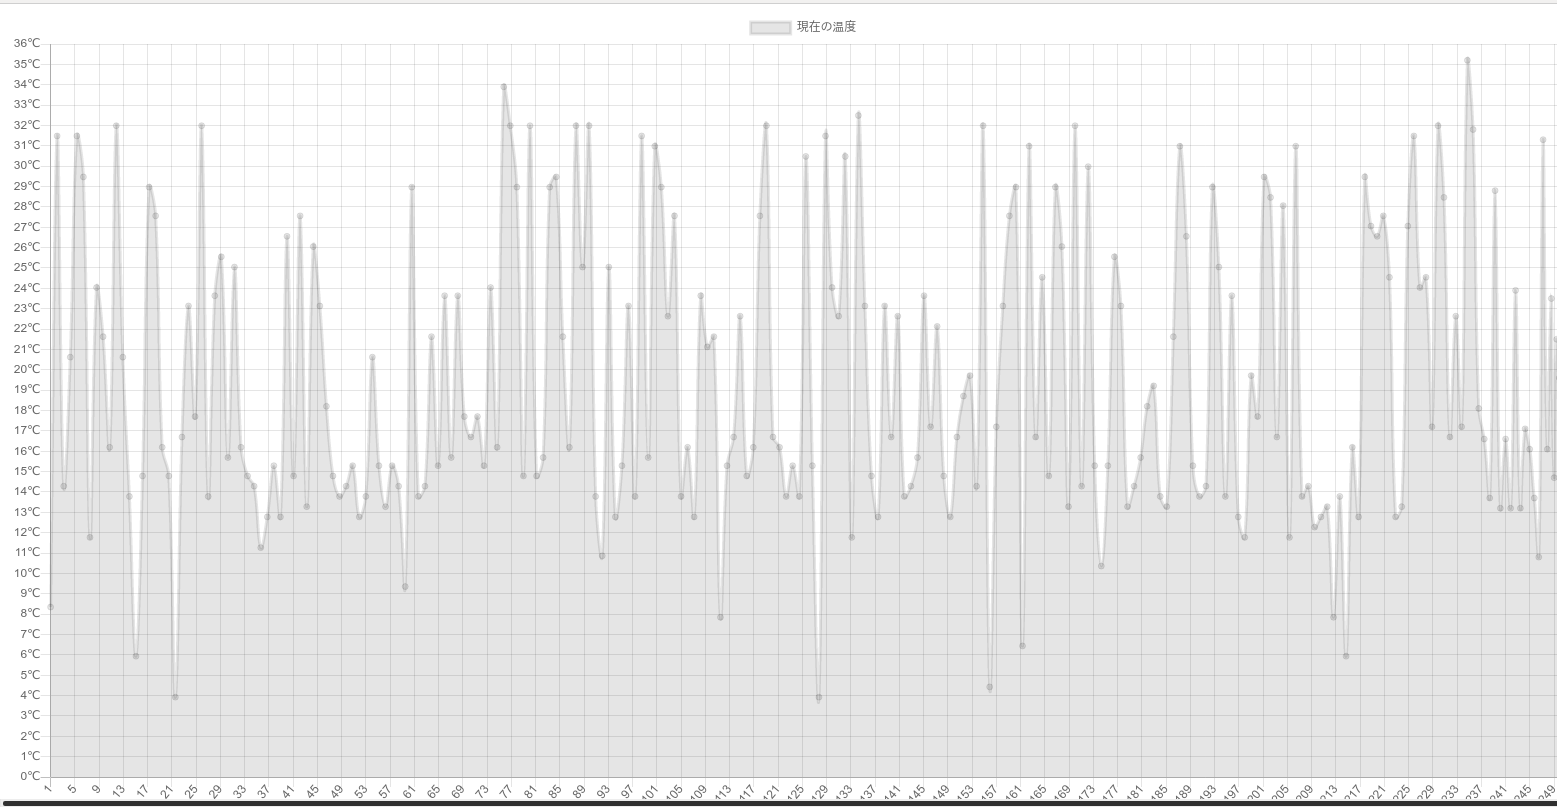
Do you have a graph that can be updated one after another?
If you feel that the update is too fast! If you feel that the update is too fast, you can use obniz.repeat() to specify the number of seconds to run the loop.
Development:Let's use WebApp
obniz has an "app" feature.
This is a HTML/JavaScript or block program written by someone and published in the form of an application.
If you find something you want to use there, you can quickly install it and use it, which is very convenient.
See What is a browser application for a brief explanation.
Parts libraries take care of the details of parts for you, and WebApps are like a superordinate entity that takes care of "every function" for you.
Very luckily (...?) There is a graphing application that uses the same temperature sensor, so let's use it.
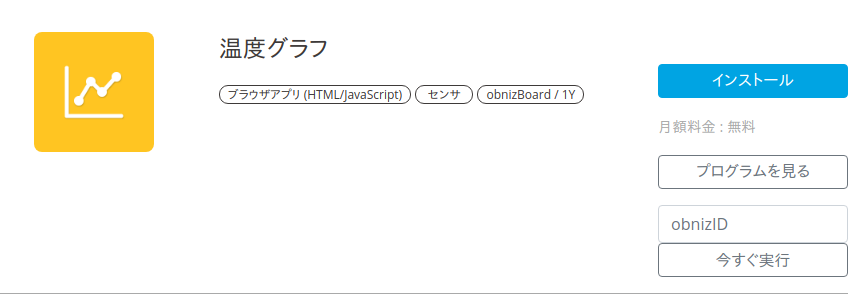
・Temperature Graph & WebApp Page
On the WebApp page, you will find several options, including the following.
If you want to try out the various options, click "Install" and run it, then click
If you are curious about what is actually written in the program, you can run it from [View Program], and then click
If you just want to try it out, click [Run Now] to run it.
(Account and device registration are required for installation..
If you haven't completed it yet, please be patient, as more details will be presented in next lesson, so please be patient!!)
Can you display the temperature graph as shown in the following image from the WebApp page for temperature graph?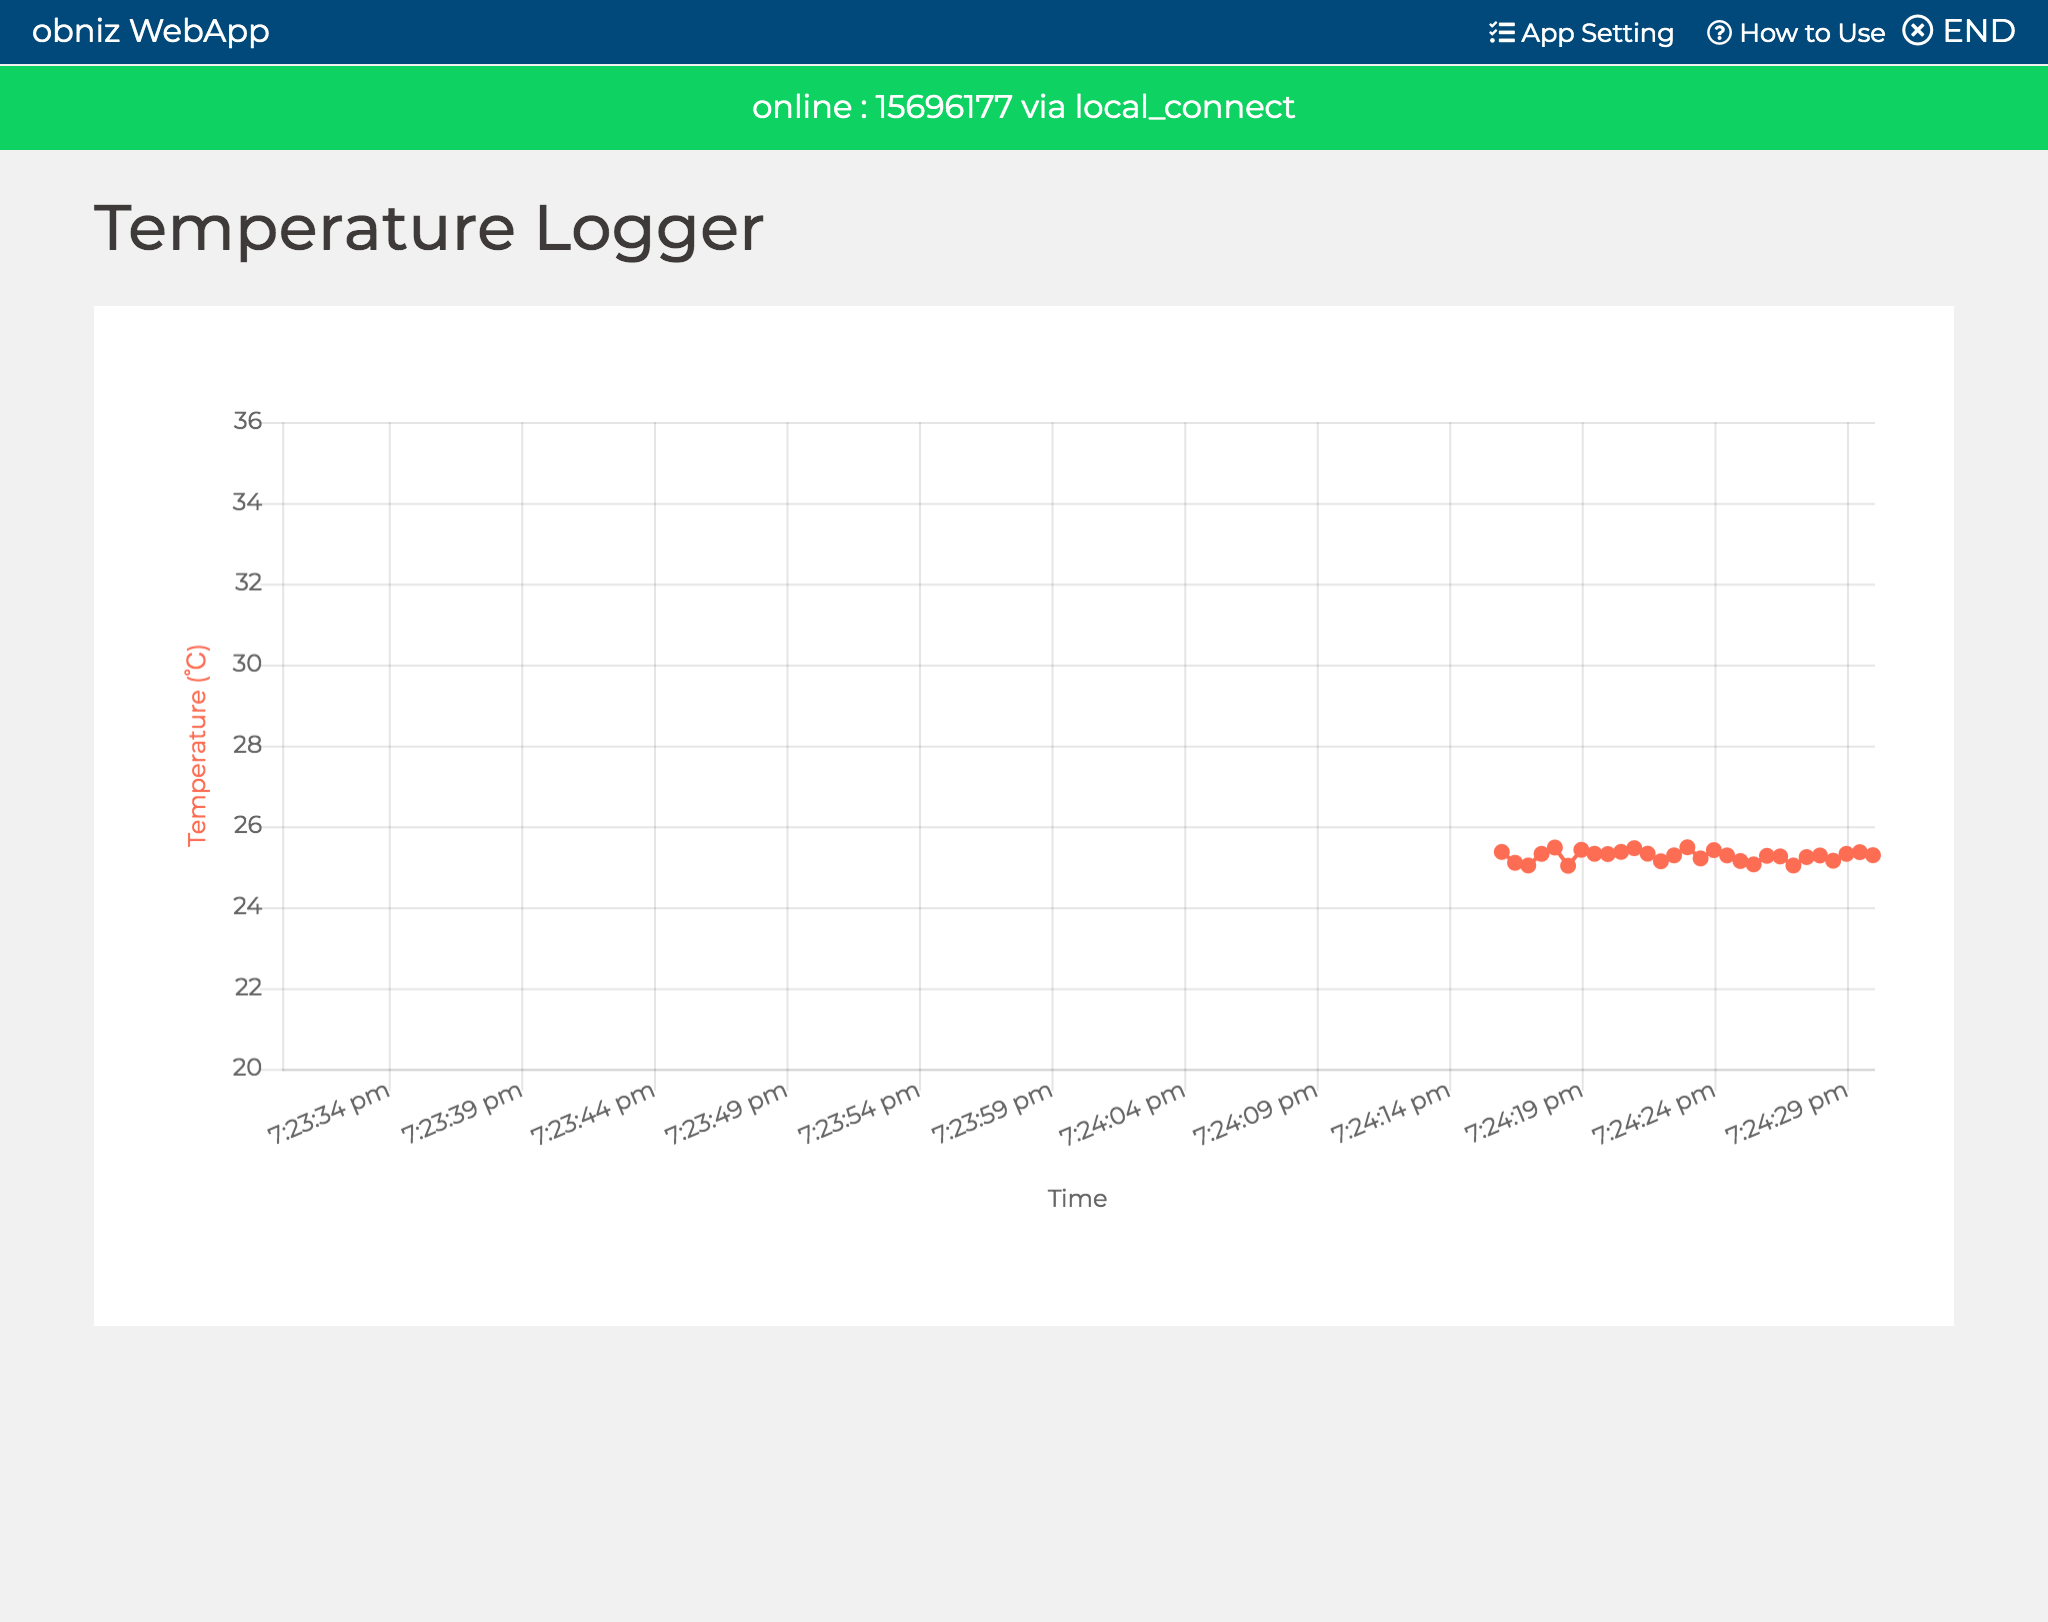
It's great to be able to use the IoT to achieve the functions you want right away without writing any programs like this.
Of course, if the feature you want is not on the app page, you can create your own app using the HTML/JavaScript knowledge!
Isn't it exciting to be able to create and publish an app with features that have never existed before, and have other people use your app?
In the next article, I'll talk about the creation and publishing of this application in more detail. So long!